End to End Data Modeling (Part 1)
Background
In this series of posts, I will be going through data warehouse design. We'll start with some application tables and build out Type 2/Slowly Changing Dimensions (SCD).
A lot of attention is paid to the engineering aspect of data engineering, i.e. infrastructure, pipelines, throughput and real time data. However, the data itself is very valuable. As this series will show, a few simple tables can tell us so much about our customer base; not just about individual users, but about our product as a whole.
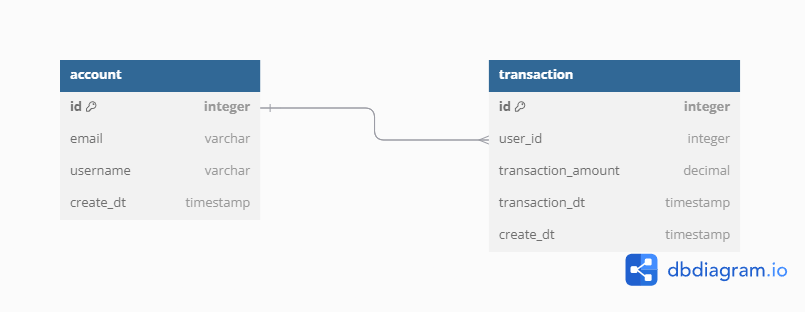
Let's imagine that we are a fintech company. We will be using the following tables:

CREATE TABLE account (
  id integer PRIMARY KEY,
  email varchar,
  username varchar,
  create_dt timestamp
);

CREATE TABLE transaction (
  id integer PRIMARY KEY,
  user_id integer,
  transaction_amount decimal,
  transaction_dt timestamp,
  create_dt timestamp
);

ALTER TABLE transaction ADD FOREIGN KEY (user_id) REFERENCES account (id);
From a "data engineering" point of view, these tables may not seem very exciting. We don't seem to have a need for real time data (more on that later). These tables don't have a lot of columns and the number of rows is probably going to be relatively small as well, at least compared to a page view table or some other product analytics table. So, what can we do with these tables?
The value of data
Let's run a simple query on the transaction table
-- The number of unique users who have used our system for a transaction
select
  count(distinct user_id)
from transaction;
Let's continue.
-- The growth of our user base
select
  date_trunc('month', transaction_dt) as transaction_month,
  count(distinct user_id) as num_users,
  count(distinct id) as num_transactions,
  sum(transaction_amount) as total_transaction_volume
from transaction
  group by date_trunc('month', transaction_dt);
If you're familiar with SQL, this all fairly standard. We could chart this data as follows:
This looks good. We can see that our product and company have nice growth.
What else can we determine?
It's also crucial to track not only our user growth but also the acceleration of that growth. For instance, if we're acquiring the same number of new users each month, our total user base is increasing, but our Month-over-Month (MoM) growth rate is flat. This means we're experiencing linear growth in user acquisition.
Monitoring the acceleration of growth helps us identify whether we're scaling effectively and if our strategies are leading to exponential growth rather than just linear. Let's write some SQL to calculate the cumulative count of users over time.
-- Create a date spine table, so we get a count
-- regardless of whether there were any sign ups
create table date_spine as
SELECT
  date_trunc('month', dd)::date as dt_month
FROM
  generate_series('2024-01-01'::timestamp, '2026-01-01'::timestamp, '1 month'::interval)
  as dd;

-- Calculate cumulative/running count of users.
select
  dt_month,
  sum(count(distinct id)) over (order by dt_month)
from
  date_spine ds
  left outer join account a
    on date_trunc('month', a.create_dt) = ds.dt_month
group by dt_month;
As you can see, by querying just a single table, we can get a lot of valuable information about the health of our company.
Next, we'll build on our data model by implementing additional metrics.